Live financial dashboards, straight from NetSuite
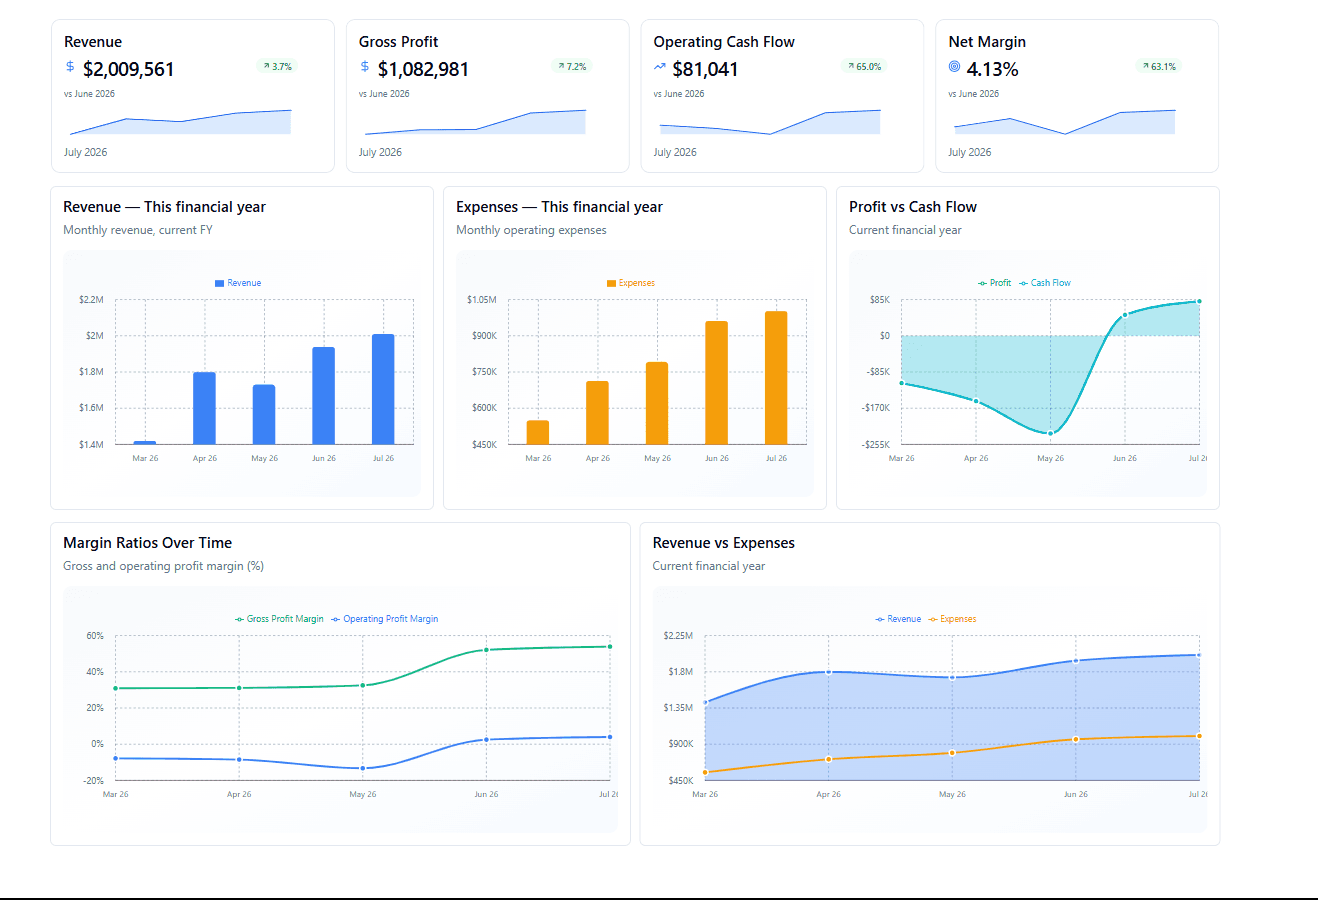
Build executive dashboards from KPI cards, charts and statement tables that read directly from your NetSuite instance. Filter by subsidiary, department, class or location. Share a read-only link with the board. No exports, no saved searches, no IT project.
- Read-only toward NetSuite
- Connect in about 15 minutes
- 7-day free trial on your first instance
- Typical time to connect NetSuite
- 15 min
- Ready-made dashboard templates
- 6
- NetSuite dimensions: subsidiary, department, class, location
- 4
- Toward NetSuite: nothing is ever written back to the ERP
- Read-only
How it works
From NetSuite login to a live board in one sitting
Setup is a connection, not a project.

- 1
Connect NetSuite
Authorize FinanceIQ against your NetSuite account. The connection is read-only toward the ERP and takes about 15 minutes. The first sync pulls in your history.
- 2
Pick a template or start blank
Choose Executive Pulse, Cash & Liquidity or another template, or add blocks one by one. Set the period once and every block follows it.
- 3
Share the link
Publish a read-only link for leadership, export any block as PNG, CSV, XLSX or PDF, and let the numbers stay current on their own.
What you get
Everything a finance dashboard needs, none of the plumbing
Boards are assembled from blocks that already understand your chart of accounts, your periods and your dimensions.
Modular blocks
Compose a board from finance-native blocks
Drag KPI cards, trend charts, breakdowns, rankings and statement tables onto a grid and resize them. Every block is wired to your NetSuite data, so there is nothing to map.
- KPI cards with sparklines and period-over-period comparisons for revenue, gross profit, EBITDA, operating cash flow and margins
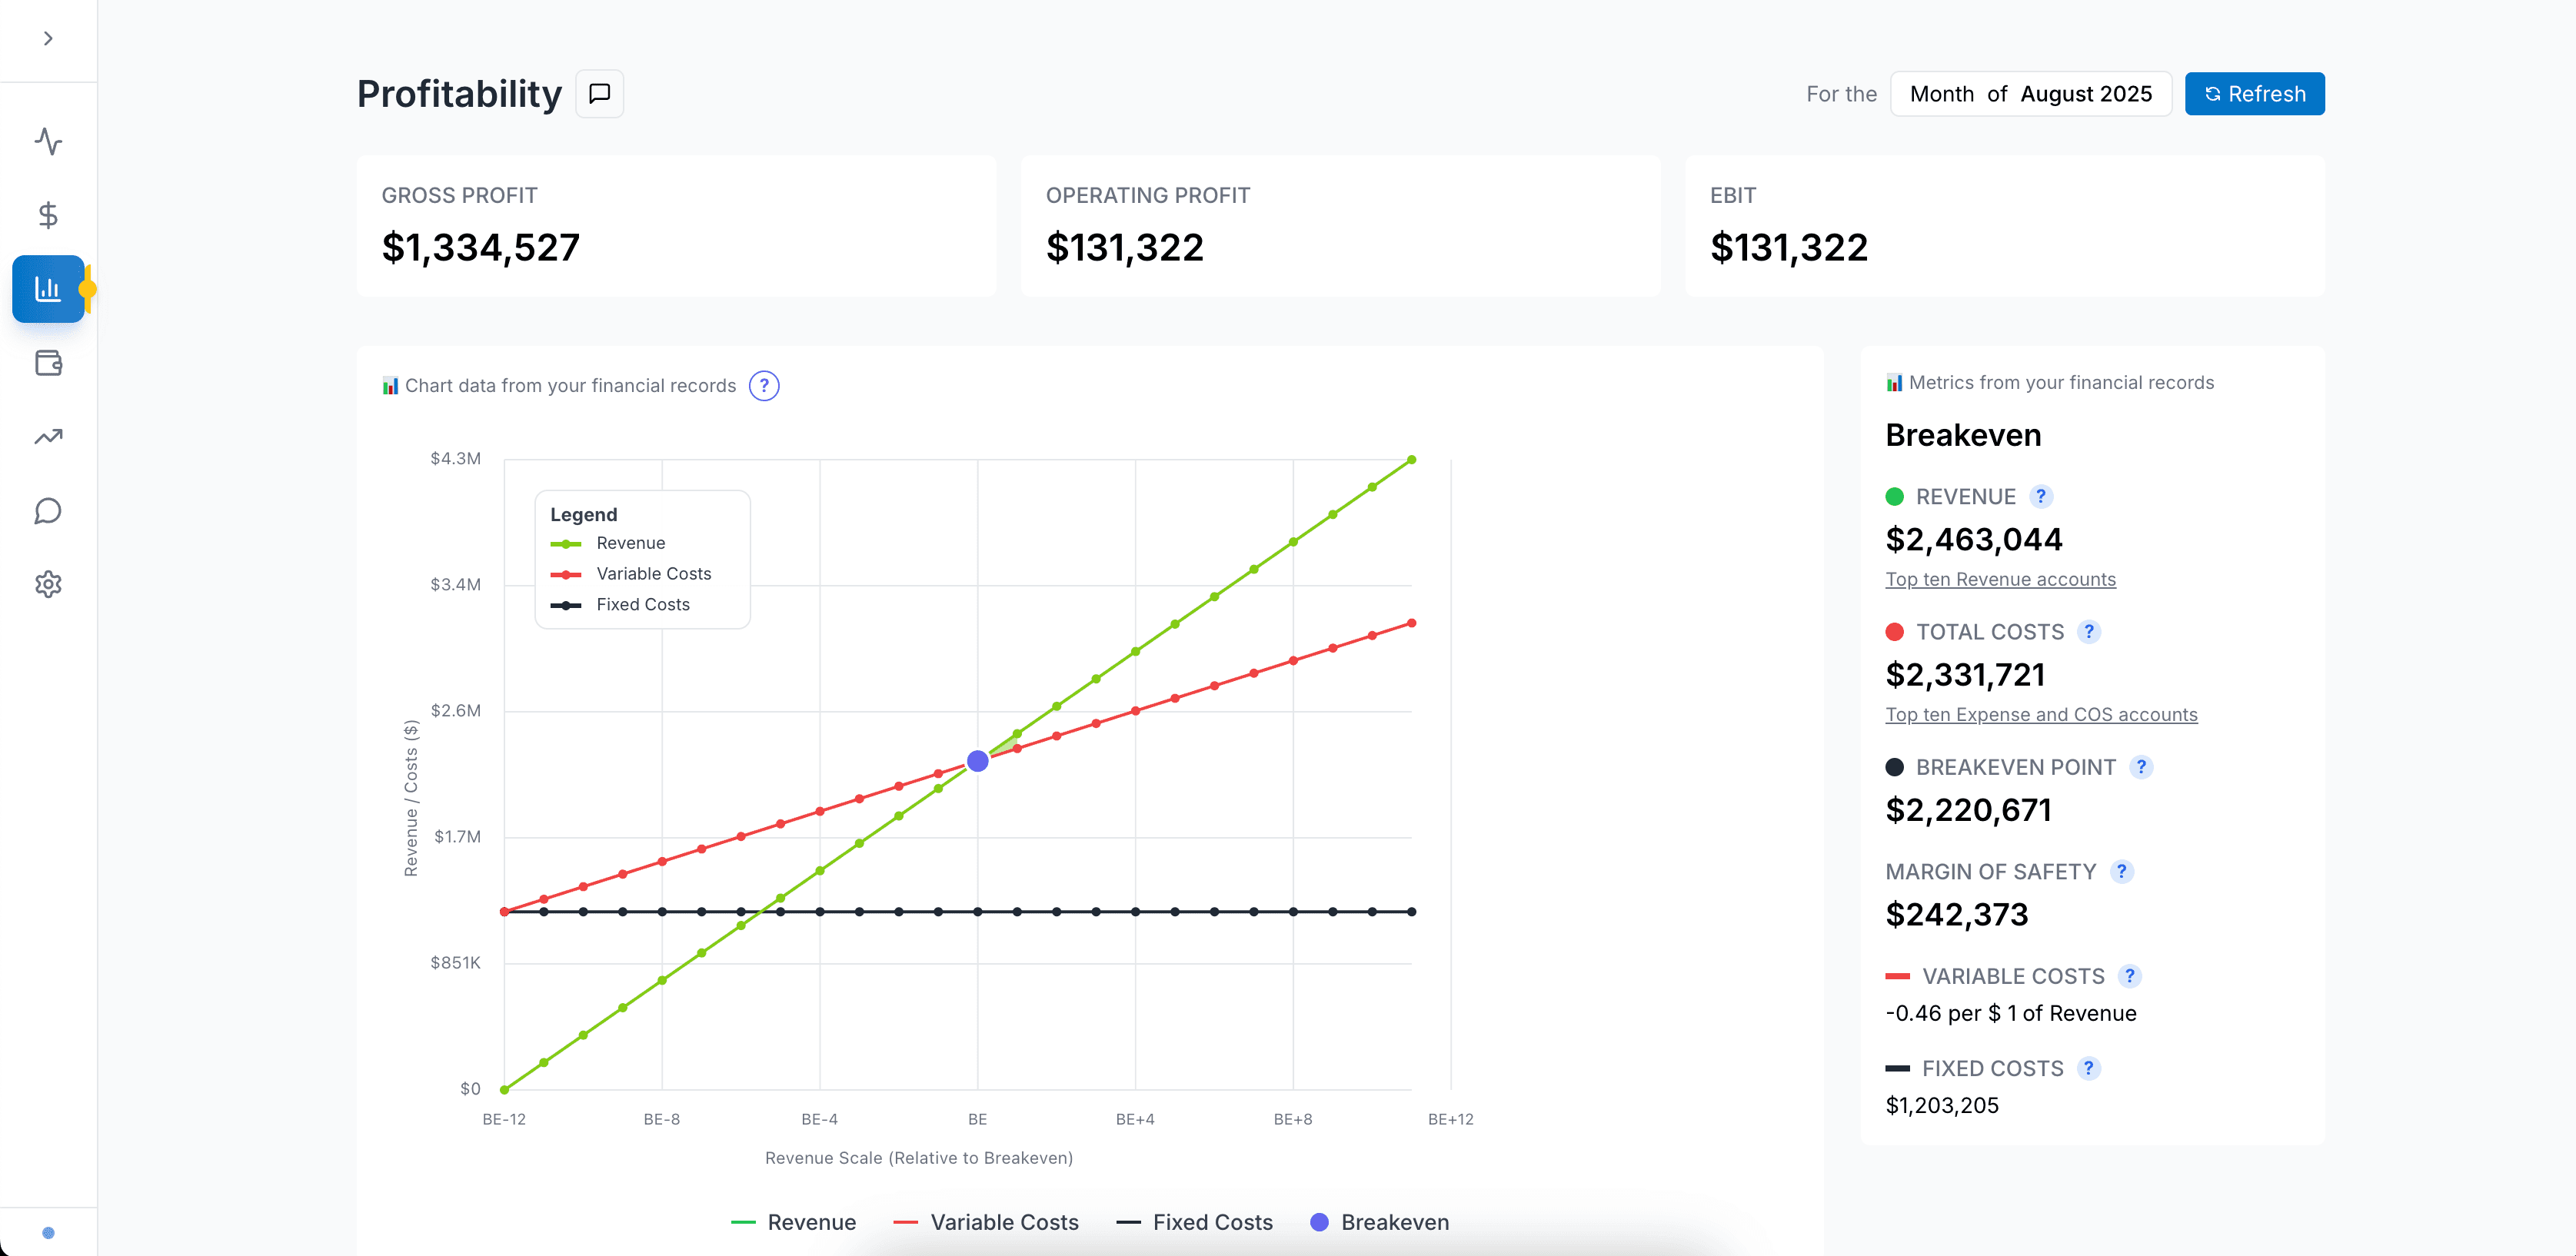
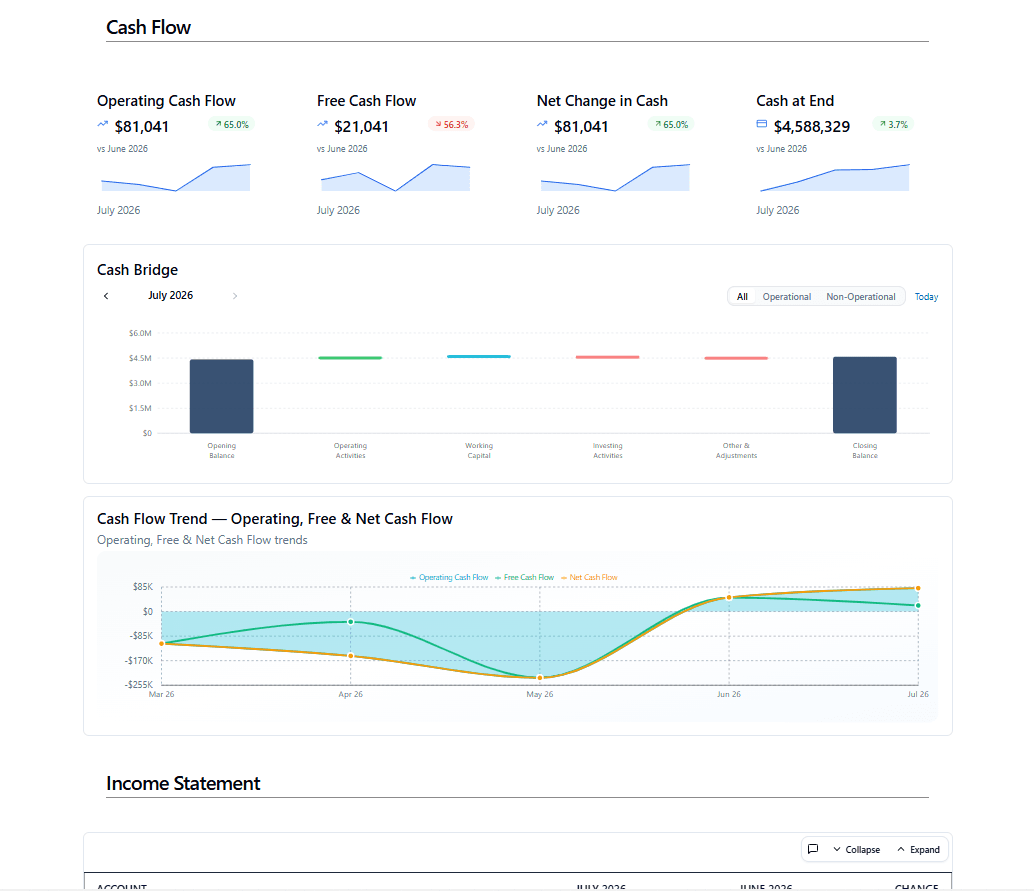
- Trend, breakeven, cash bridge and cash flow waterfall charts
- Top revenue and top expense account rankings
- Income statement, balance sheet and cash flow tables with expand and collapse
Dimensions
Slice by the segments you already track in NetSuite
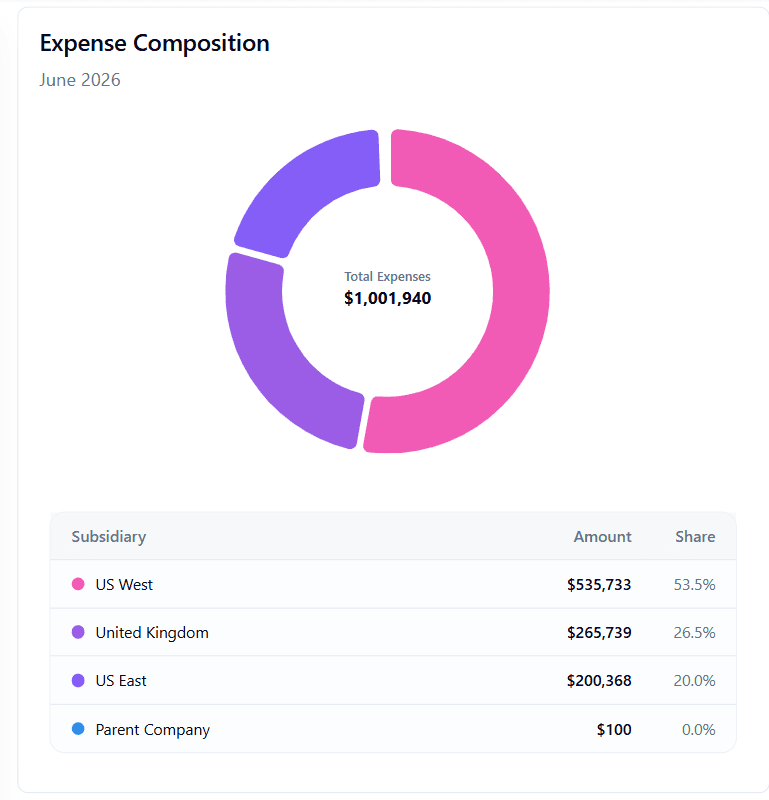
Filter a whole board or a single block by subsidiary, department, class or location. Consolidated one moment, one entity the next, with no second dashboard to maintain.
- Multi-entity view across every subsidiary on the instance
- Per-block filters so one board can compare departments side by side
- Donut and ranked breakdowns by any dimension
- A Department Spend template scoped to the department you pick
Sharing
Share a link, not a spreadsheet
Publish a read-only link for the board, an investor or a department head. They open the current numbers in a browser, with no FinanceIQ login and no NetSuite license.
- Public or private read-only links per board
- Viewers see the latest synced data every time they open it
- No extra logins or NetSuite licenses for viewers
- Editing rights stay with the finance team
Templates
Start from a template, tune it in minutes
Six board templates cover the questions leadership asks every month. Pick one, point it at your instance and adjust the blocks that matter to you.
- Six templates, from Executive Pulse to Liquidity & Capital Structure, all listed below
- Applied against your own instance, so the first render already shows your numbers
- Adjust, add or remove any block after applying
- Set the period once and every block follows it
Templates
Six boards, ready on day one
Every template below ships inside FinanceIQ. Apply one to your instance, then resize, re-point or remove any block.
- Executive
Executive Pulse Dashboard
Company-wide at-a-glance: headline KPIs, revenue and expense trends, profitability and cash conversion.
Includes
- Revenue
- Gross Profit
- Operating Cash Flow
- Net Margin
- Revenue - This financial year
- Expenses - This financial year
- +3 more
- Analysis
Cash & Liquidity Dashboard
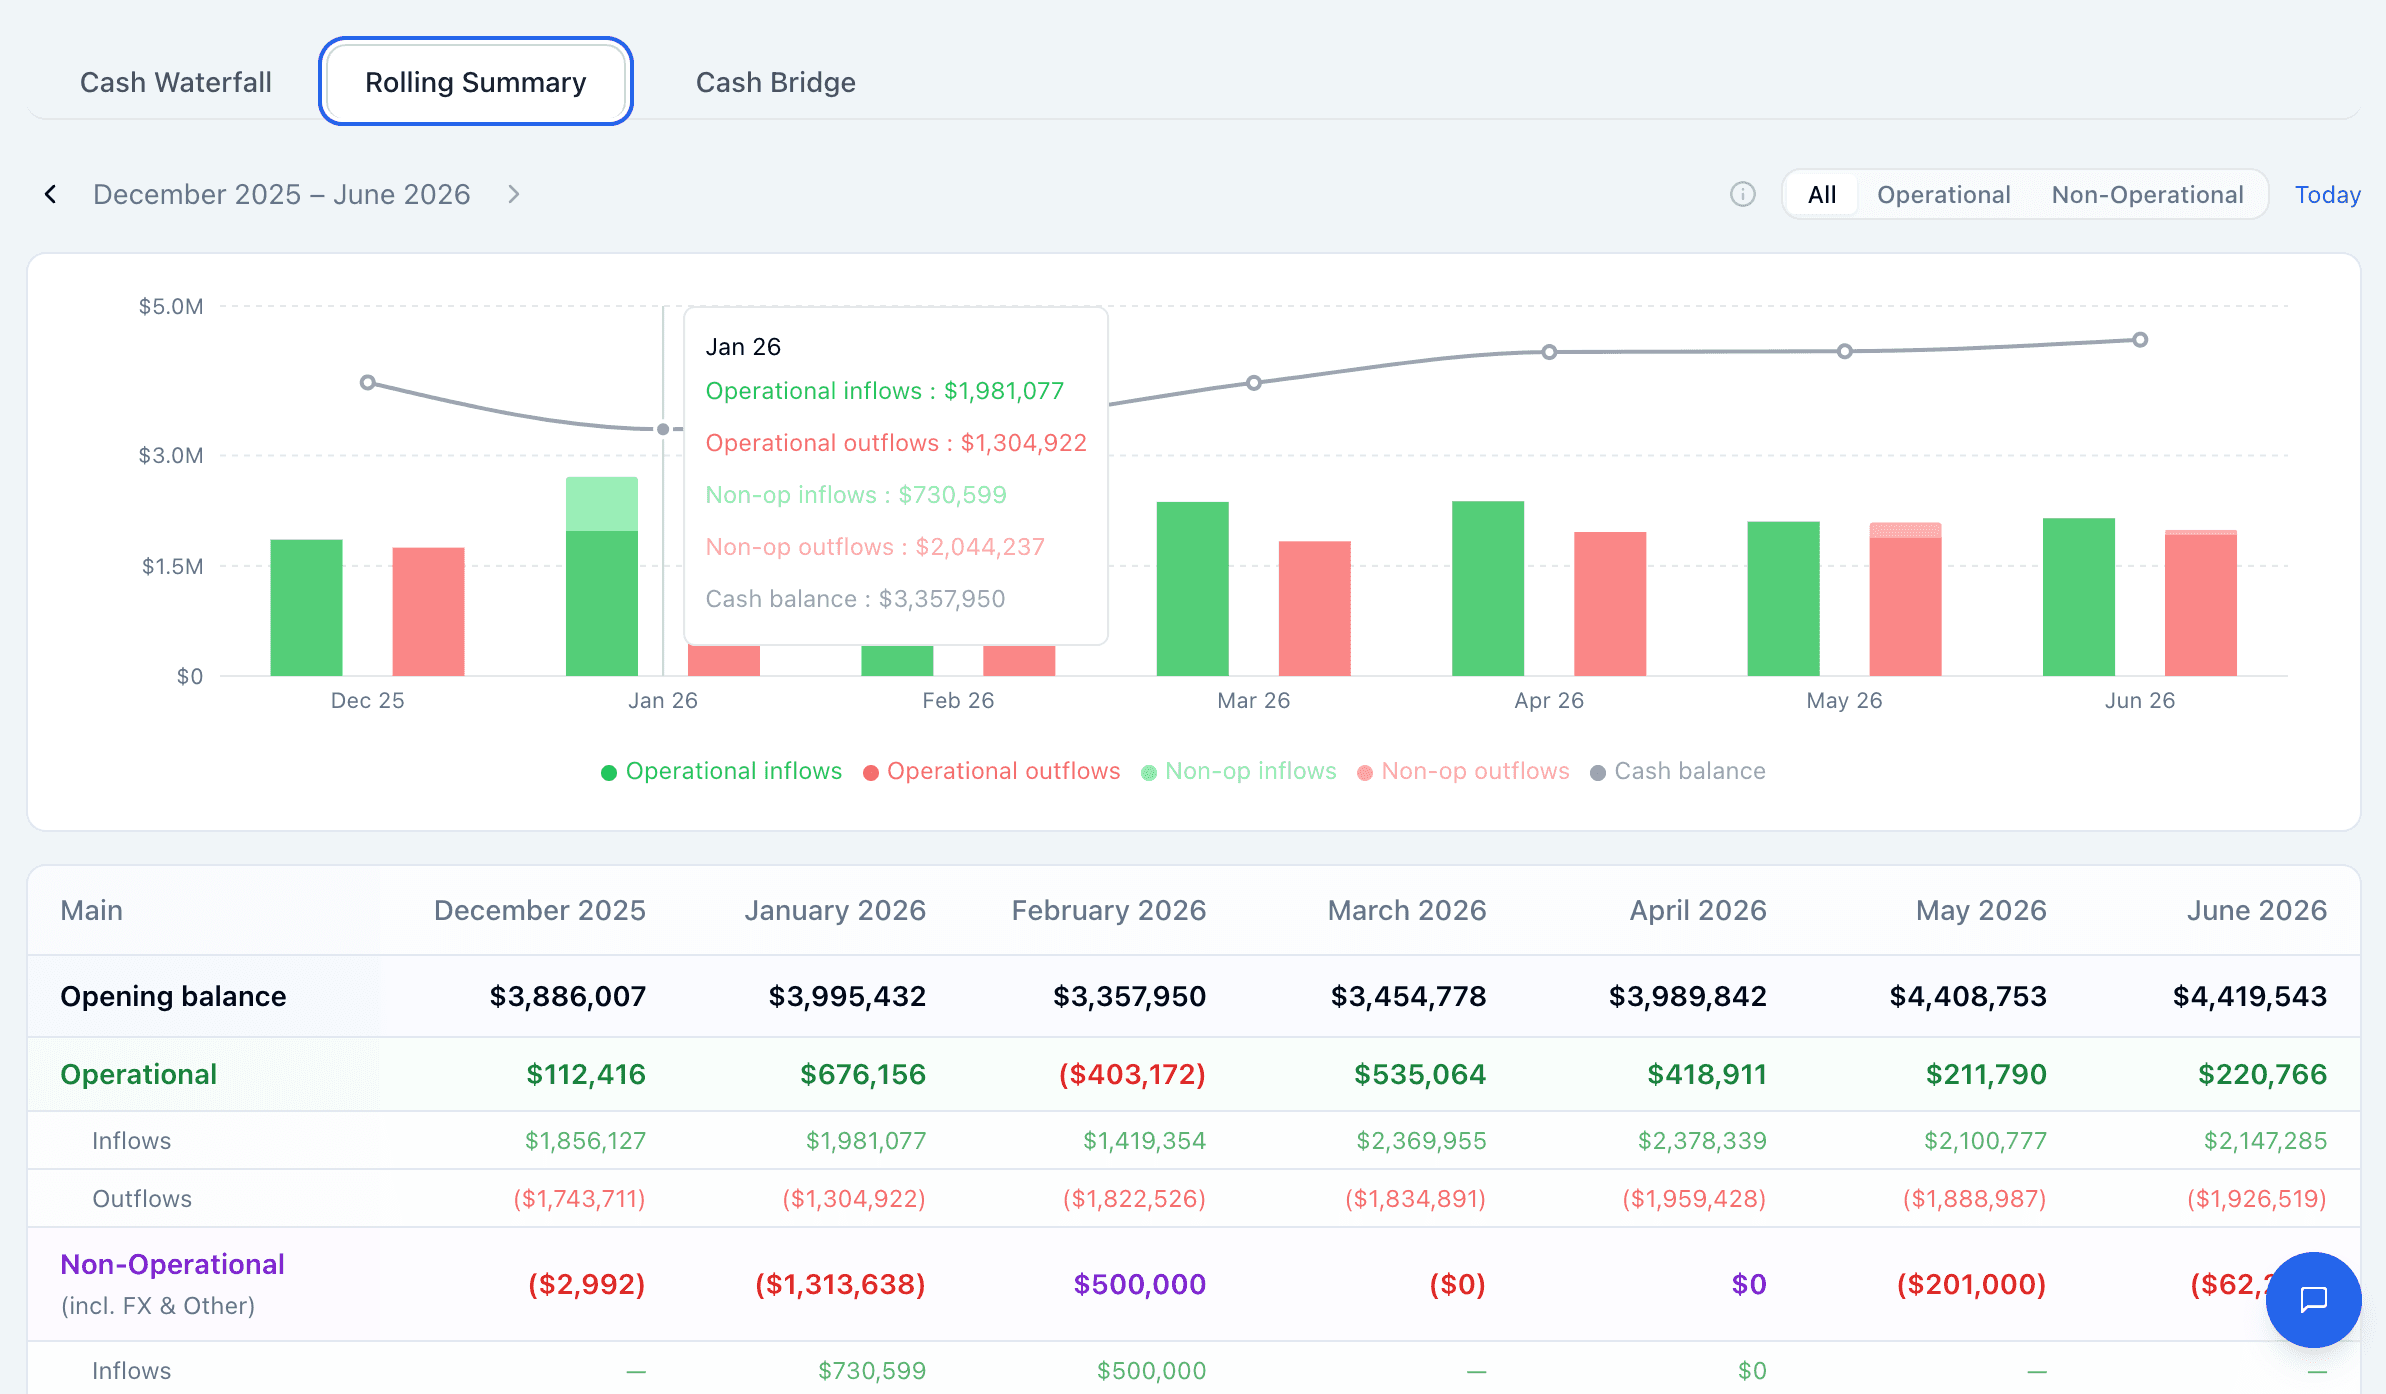
Cash generation and conversion: net cash flow, cash bridge, rolling cash summary and profit-to-cash.
Includes
- Total Revenue
- Expenses
- Net Cash Flow
- Cash Bridge
- Rolling Cash Summary
- Profit vs Cash Flow
- +1 more
- Analysis
Revenue & Growth Dashboard
Revenue performance and growth: trend, month-over-month growth, revenue by subsidiary and top accounts.
Includes
- Revenue
- Revenue YTD
- Revenue Growth
- Gross Profit
- Revenue - This financial year
- Monthly Revenue Growth
- +2 more
- Analysis
Profitability & Margins Dashboard
Margin performance: gross/operating/net margins, margin trend, breakeven and EBIT.
Includes
- Gross Margin
- Operating Margin
- Net Margin
- EBIT
- Margin Ratios Over Time
- Breakeven Analysis
- +1 more
- Analysis
Department Spend Dashboard
Department-scoped spend: spend trend, top expense accounts and profitability by department. Filter to your department.
Includes
- Department Spend
- Cost of Goods Sold
- Cost / Revenue
- Expenses - This financial year
- Top Expense Accounts
- Profitability by Department
- Analysis
Liquidity & Capital Structure Dashboard
Liquidity and leverage position: current/quick ratios, working capital, debt-to-equity, balance-sheet composition and assets trend.
Includes
- Current Ratio
- Quick Ratio
- Working Capital
- Debt-to-Equity
- Assets Over Time
- Balance Sheet - Assets
- +4 more
Templates are starting points, not fixed layouts. Every KPI card, chart and table can be changed after applying, and a blank board is always one click away.
Included with every instance
Ask Finley why a number moved
Finley is the AI analyst inside FinanceIQ. It answers in plain English using your accounts, your dimensions and your history, and it can add the block that answers the question straight onto your board.
- Grounded in your synced NetSuite data, not a generic model
- Break any answer down by subsidiary, department, class or location
- Compose dashboards and reports from chat
Why did gross margin drop in July for the US West subsidiary?
Gross margin fell 3.1 points to 52.4%. Cost of sales rose 9% on freight and packaging while revenue grew 2%. Two accounts explain most of it: Freight-In and Packaging Supplies.
Illustrative exchange. Finley answers from your own NetSuite data and is an analysis tool, not a licensed financial advisor.
Before and after
Same NetSuite data. A very different Monday.
What changes when the dashboard reads from the ERP instead of from an export.
| Exports and saved searches | FinanceIQ dashboards | |
|---|---|---|
| Data freshness | As current as the last export someone remembered to run | Refreshes after every NetSuite sync, with no one touching it |
| Building a chart | A saved search, an export, a pivot, a chart, a paste into slides | Pick a block, pick a metric, pick a period |
| Multi-entity view | One export per subsidiary and a consolidation tab | One board, filtered by subsidiary or consolidated |
| Sharing | An attachment that is out of date on arrival | A read-only link that is current every time it opens |
| Who can build it | The one person who knows saved searches | Anyone on the finance team |
| Adding a viewer | Another NetSuite license or another email thread | Send the link |
Who it's for
Built for the people who answer for the numbers
CFOs and VPs of Finance
Walk into the board meeting with a dashboard that is already current, and answer follow-up questions live instead of next week.
Controllers
Retire the export ritual. Spend the days after close reviewing numbers, not reformatting them.
FP&A analysts
Slice revenue and spend by dimension, chase a variance to the account, and give every stakeholder their own view of the same data.
NetSuite admins
Nothing to build or maintain inside NetSuite. One read-only connection, no custom saved searches, no scripts to babysit.
Security
Your books stay in NetSuite. Your data stays yours.
FinanceIQ is a reporting layer on top of NetSuite, not a replacement for it. The connection reads your financials; it never posts, edits or deletes a transaction. NetSuite remains the system of record.
Read-only toward the ERP
FinanceIQ reads the general ledger, AR, AP and reporting segments. It cannot write to NetSuite.
Encrypted end to end
TLS 1.2 or higher in transit, including to the NetSuite API. AES-256 at rest.
Isolated per tenant
Row-level security at the database layer keeps each instance's financial data separate.
Compliance roadmap
SOC 2 Type I audit planned for Q4 2026. Our Security page and Trust Center publish the current posture.
Built by an operator, not a vendor
“No matter the role, the problem was always the same: critical business data was trapped behind saved searches, disconnected reports, and overly complex workflows. The information existed, but monitoring business health and supporting executive decision-making was far harder than it should have been.”
Tim Wallace
Founder, FinanceIQ. Former CEO, fractional CFO and NetSuite consultant.
FAQ
Questions finance teams ask before they connect
How long does it take to get a dashboard running?
Connecting NetSuite takes about 15 minutes. Once the first sync completes you can open a template board and it fills with your data, so a first dashboard can be in front of leadership the same day.
Does FinanceIQ change anything in NetSuite?
No. The connection is read-only toward the ERP. FinanceIQ reads the general ledger, receivables, payables and reporting segments. It never posts, edits or deletes a transaction. NetSuite stays the system of record.
Can I filter dashboards by subsidiary, department, class or location?
Yes. Those four NetSuite segments come through as dimensions. Filter an entire board or override the filter on a single block, so one board can show consolidated numbers next to a single entity.
Can people without a FinanceIQ login view a dashboard?
Yes. Every board can publish a read-only public or private link. Viewers open the current numbers in a browser and need neither a FinanceIQ account nor a NetSuite license. Editing stays with your team.
How is this different from the dashboards inside NetSuite?
FinanceIQ is a finance-specific layer on top of NetSuite: KPI cards with comparisons, breakeven and cash bridge charts, statement tables and dimension filters that work without saved searches, read-only sharing outside NetSuite, and Finley for plain-English questions. NetSuite remains where the transactions live.
Do you support QuickBooks, Xero, Sage or other ERPs?
No. FinanceIQ is built exclusively for Oracle NetSuite, which is what lets the blocks understand your accounts, periods and dimensions without configuration.
How is my financial data protected?
TLS 1.2 or higher in transit, AES-256 at rest, and row-level security that isolates each instance's data at the database layer. A SOC 2 Type I audit is planned for Q4 2026. Our Security page and Trust Center describe the full posture.
Put your NetSuite numbers on a live board this week
Start a 7-day free trial, connect NetSuite in about 15 minutes, and share your first dashboard the same day.
- Read-only toward NetSuite
- Connect in about 15 minutes
- 7-day free trial on your first instance